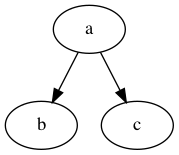
When I want a graph like this:

my go-to tool is the dot command from Graphviz. There’s a simple input language to describe a graph that’s easy to write by hand but most often I generate the input programmatically. It’s the perfect way to let a program generate graphical output.
Graphs like the one above are really easy to generate but dot is much more powerful. Adrian Ancona has an excellent post that serves as a go by for many of the basic dot capabilities. You can control the shape, color, and other attributes of the nodes and edges.
I found Ancona’s post really useful. It’s easy to look at the pictures to find one that more or less matches what you want and see the corresponding spell to generate it. If you, even occasionally, need to generate a graph, you should consider bookmarking the post—I have.
UPDATE : Added link to Ancona’s post.
