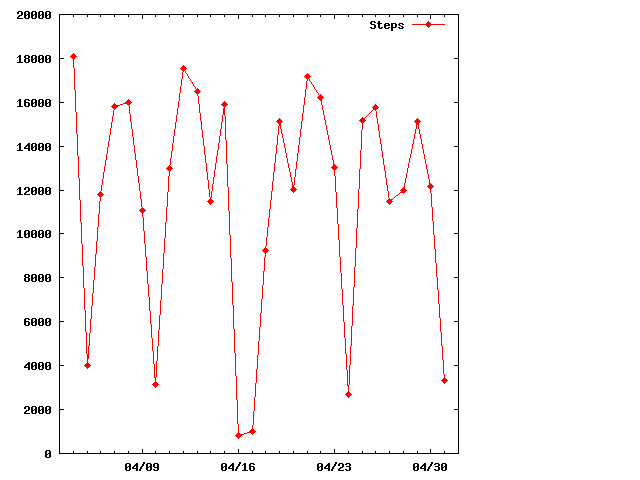
About a year ago, I bought Gordon Bell and Jim Gemmell’s book Total Recall: How the E-Memory Revolution Will Change Everything. That was the first time I had ever read about the health benefits of taking at least 10,000 steps every day. Right afterward, of course, I began seeing references to it everywhere. I like measuring and keeping track of things—although I’m not as obsessive as these guys—so I ordered an Omron HJ-150 Pedometer from Amazon and started keeping track. I walk a lot and I was sure that I was easily doing 10,000 steps a day. Hah! Not even close. It turns out it was more like 6000–7000 so I started walking more and every morning I would record the previous day’s steps in an Org-mode table. Here’s the last 4 weeks worth of data:
| Date | Steps |
|---|---|
| 18078 | |
| 4025 | |
| 11820 | |
| 15827 | |
| 15990 | |
| 11048 | |
| 3151 | |
| 12974 | |
| 17522 | |
| 16498 | |
| 11476 | |
| 15877 | |
| 840 | |
| 984 | |
| 9253 | |
| 15125 | |
| 12010 | |
| 17198 | |
| 16229 | |
| 13029 | |
| 2674 | |
| 15151 | |
| 15746 | |
| 11496 | |
| 12001 | |
| 15112 | |
| 12170 | |
| 3334 |
Of course, once you have data like this there’s an overwhelming urge to do something with it. If I were an R user, I could run all sorts of statistical calculations on it but since I’m not, I had to settle for graphing it. That’s OK because it gives me an excuse to play with Babel some more. I just added
#+BEGIN_SRC gnuplot :var data=steps :file http://irreal.org/blog/wp-content/uploads/2011/05/wpid-steps.png
set size .75,1
set xdata time
set timefmt "%Y-%m-%d"
set xrange ["2011-04-03":"2011-05-02"]
set timefmt "%Y-%m-%d-00:00:00"
set format x "%m/%d"
plot data using 1:2 with linespoints pointtype 13 title 'Steps'
#+END_SRC
to the end of the file, typed C-c C-c and had a nice graph of my data:

As you can see, I take Sundays off. Perhaps I’ll install R and run some statistics on it. Babel has an R mode, you know.
